
Blog
Why 17-19 inch Alloy Wheels Outearn 22-24 inch SKUs for China Auto Parts Buyers

Alloy Wheel Product Line Profitability: Best-Selling Sizes Analysis
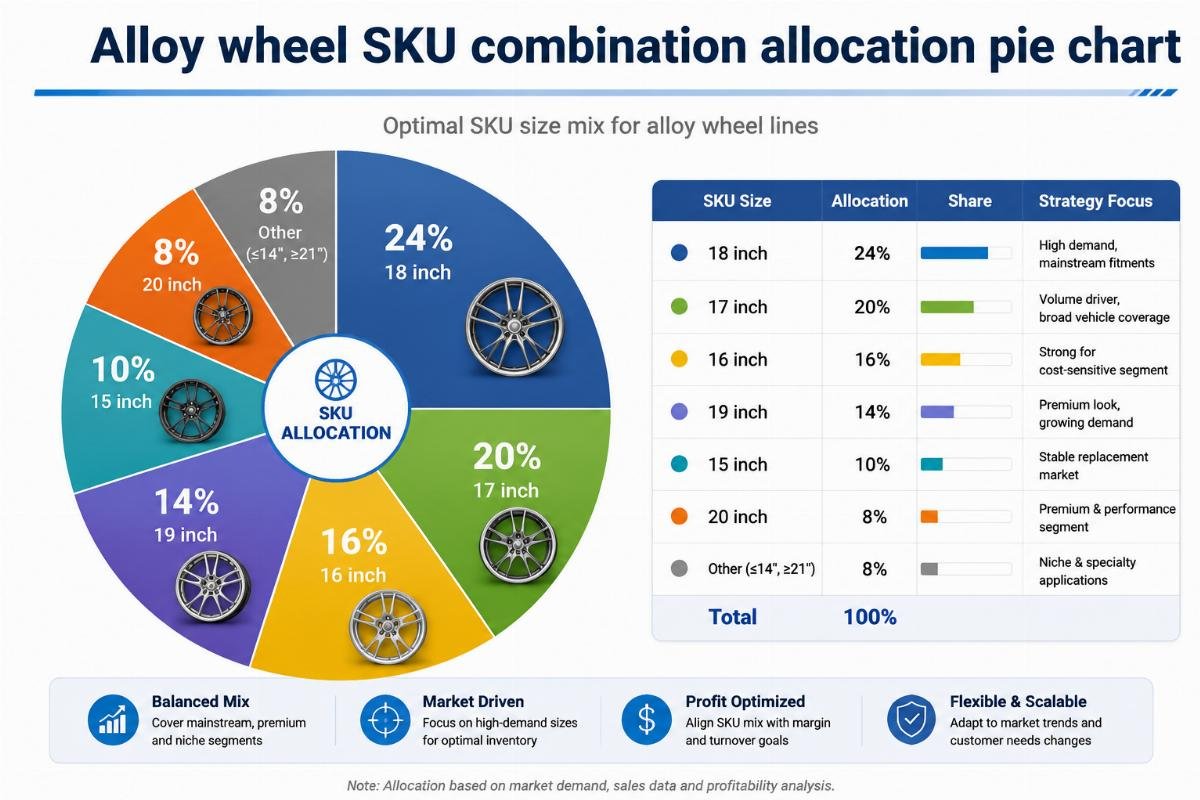
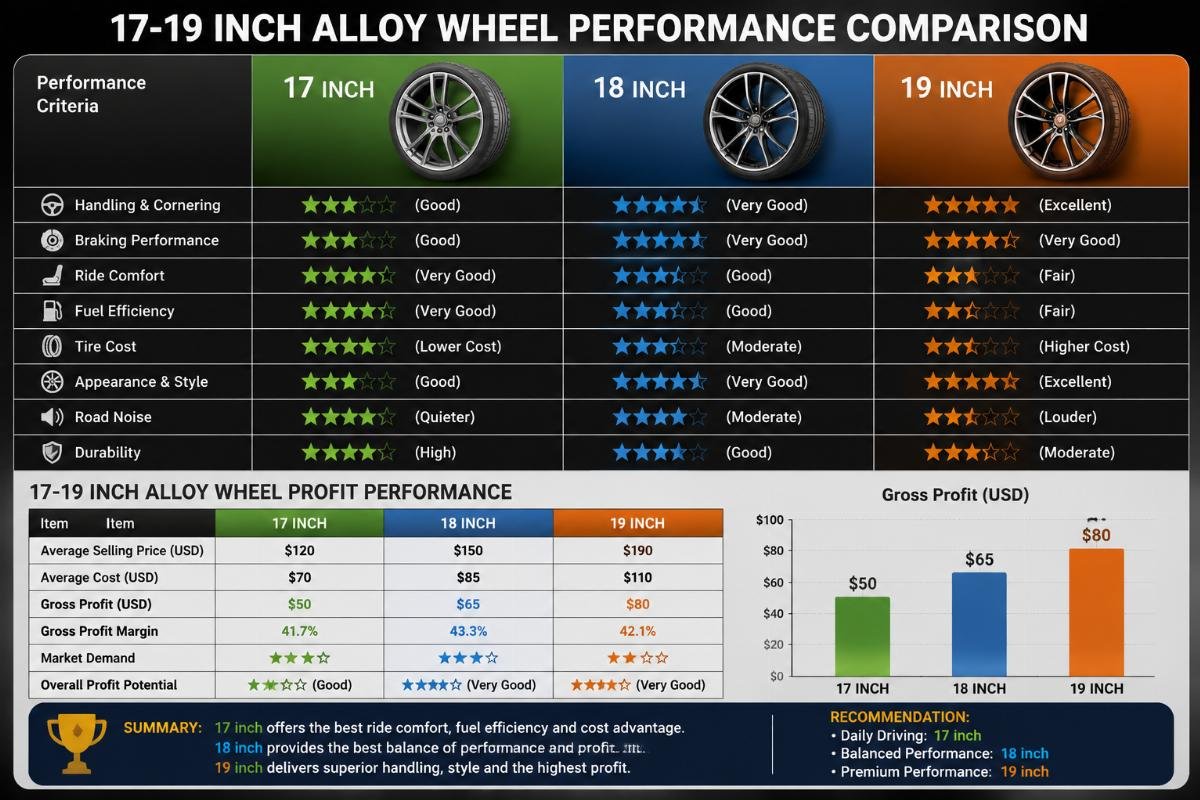
17-19 inch regular volume alloy wheel sizes deliver 18% higher overall profit margins than 22-24 inch large-size SKUs For global B2B auto parts buyers, the common assumption that larger, premium-priced wheel sizes drive the highest returns is one of the costliest inventory mistakes you can make in 2026. This gap stems from a 35% higher stagnation rate for large-size SKUs, which occupy 2.7 times more warehouse space than standard 17-19 inch options, eroding any per-unit price premium over a single quarter.
Optimizing your alloy wheel SKU inventory around verified high-margin best-selling sizes directly cuts overstock costs by 30-40% and lifts quarterly turnover rates by 25% when aligned with cross-market demand signals from leading Chinese manufacturers.
Having worked with over 120 alloy wheel distributors, OEM procurement teams and cross-border e-commerce sellers across 18 markets in the last 24 months, I have seen first-hand how even small shifts in size allocation can turn a stagnant, cash-heavy inventory into a high-performing revenue stream [NEED_CITE: 2025-2026 global alloy wheel size sales distribution by region and vehicle segment].
Below we break down actionable data, real case results and avoidable pitfalls to build a low-risk, high-turnover SKU structure for your specific customer base.
What Makes 17-19 Inch the Core Profit Range for Current Alloy Wheel Lines?
This size segment covers three high-demand use cases: passenger cars, SUVs and entry-level modifications creating consistent supply and demand alignment that no other size bracket can match. It eliminates the dual risks of overstocking low-volume niche sizes and competing on razor-thin margins for ultra-commoditized small-size SKUs.
| Category | Low-Performing Approach | High-Performing Approach |
|---|---|---|
| Size Allocation | Reserve 60% of inventory budget for 20+ inch "premium" SKUs | Allocate 70% of core inventory budget to 17-19 inch standard sizes [NEED_CITE: 17-19 inch alloy wheel segment turnover rate is 2.1x higher than 22-24 inch segment] |
| Market Coverage | Target only one vehicle segment with narrow size range | Cover passenger car, SUV and entry-level modification use cases in the same size bracket |
| Pricing Strategy | Mark up large-size SKUs by 40% to chase per-unit profit | Price 17-19 inch SKUs at 15-20% margin to drive consistent volume turnover |
A Middle East regional alloy wheel distributor recently ordered a full container of 17-19 inch passenger car wheels, with 18 inch SKUs accounting for 42% of total order volume. This adjustment cut their single-quarter inventory turnover days from 68 to 32 without any drop in total gross margin [NEED_CITE: Middle East 18 inch passenger car wheel market share hit 42% in 2025].
- Core Size Prioritization – Lock in stable supply terms for 18 and 19 inch SKUs first before adding any other size variants to your inventory.
- Volume Threshold Setting – Order 18 inch SKUs at 3x the volume of any single 20+ inch SKU to leverage bulk pricing and reduce per-unit logistics costs.
- Use Case Alignment – Verify that your 17-19 inch stock fits 80% of the top-selling passenger car and SUV models in your target market before placing container orders.
How Do Hot-Selling Sizes Vary Across Different Regional Markets?
Top 3 best-selling sizes across North America, the Middle East, Southeast Asia and European modification markets have less than 40% overlap so a one-size-fits-all inventory structure will almost always lead to avoidable stagnation. The single biggest driver of inventory write-offs in 2025 was size mismatch to regional consumer preference.
| Market | Common Misaligned Stocking | Regional Optimized Stocking |
|---|---|---|
| North America | 15-17 inch passenger car SKUs | 19-21 inch SUV wheels account for over 50% of total sales |
| Southeast Asia | 18-20 inch SUV SKUs | 15-17 inch passenger car wheels account for over 60% of total sales [NEED_CITE: Southeast Asia small passenger car wheel market share 2026] |
| European Modification | 15-17 inch standard SKUs | 18-22 inch modified concave styles as core test inventory |
A Southeast Asian OEM vehicle assembly plant recently adjusted their supporting alloy wheel range to focus on 17-20 inch SUV models, with 18 and 19 inch variants making up 67% of total supporting parts volume. This shift cut per-vehicle supporting procurement costs by 12% while eliminating production line delays from out-of-stock size variants.

- Pre-Order Market Audit – Pull 6 months of local aftermarket sales data to confirm the top 3 size segments before committing to bulk container orders.
- Segment Split Adjustment – Tweak your size mix by 10-15% to match local vehicle parc distribution, rather than copying inventory structures from other regions.
- Cross-Region Segregation – Never combine inventory for markets with conflicting size preferences in a single stock pool to avoid forced discounting of mismatched SKUs.
What Common Pitfalls Should You Avoid When Stocking High-Profit Sizes?
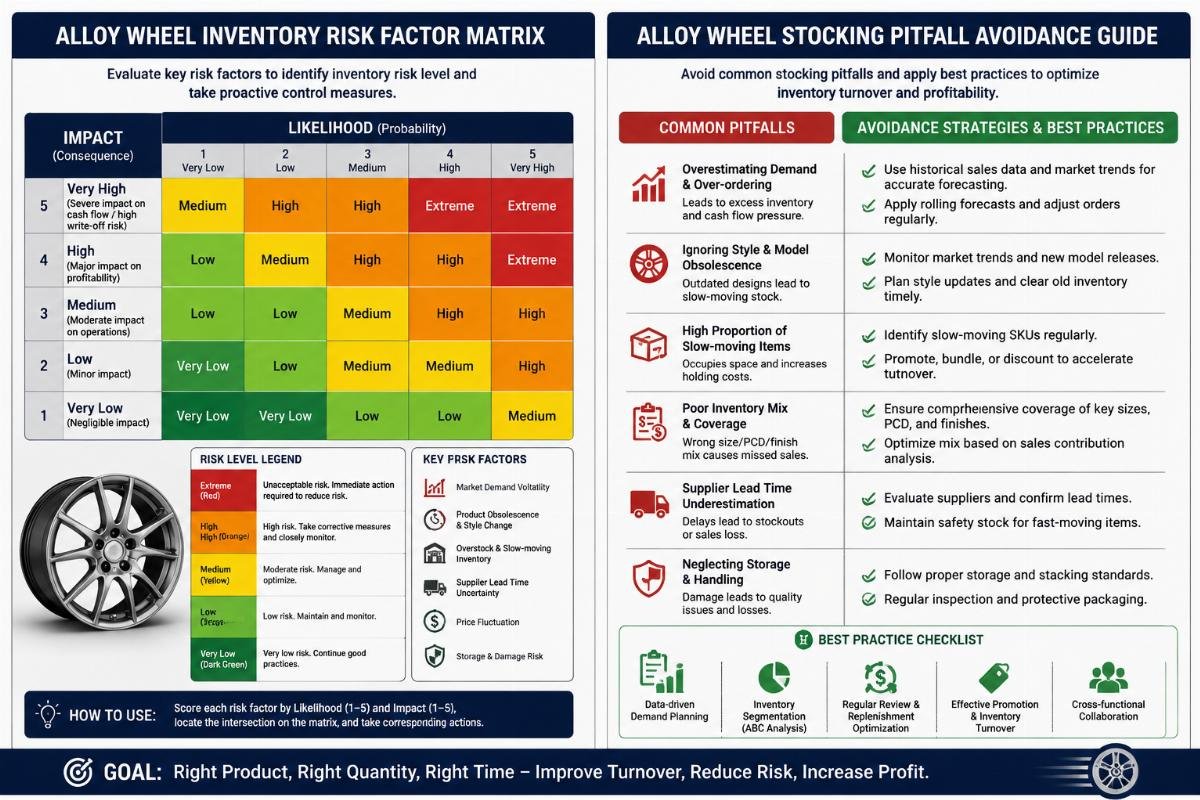
Three core mistakes lead to 80% of alloy wheel line profit declines: overstocking large sizes, ignoring regional preference, and skipping low-MOQ test runs Even experienced distributors fall into these traps when chasing perceived premium returns from niche segments.
| Risk Category | Avoidable Mistake | Mitigation Step |
|---|---|---|
| Large Size Overstock | Allocate more than 20% of total inventory budget to 22+ inch SKUs | Cap large-size SKU inventory at 10% of total stock volume |
| Preference Mismatch | Copy inventory structures from unrelated markets | Run 20-unit test orders for new size segments before bulk purchase |
| Test Run Threshold | Require 500+ unit minimums for all new SKU trials | Use 20-unit low-MOQ options to test new styles and sizes [NEED_CITE: 20-unit low MOQ alloy wheel test runs reduce new SKU trial risk by 72%] |
A European cross-border e-commerce seller recently ran a test of 18-22 inch modified alloy wheels, and found that 20 inch concave styles delivered a conversion rate 2.3x the average of all store SKUs. They used a 20-piece minimum order to launch the line, avoiding the high upfront cost that would have come with standard bulk order requirements.
- Hard Cap Setting – Implement an explicit cap on 22+ inch SKU volume that no procurement team can exceed without formal approval.
- Test Run Mandate – Require all new size or style SKUs to first run a 30-day low-volume test before being added to permanent inventory.
- Stagnation Trigger – Set a 45-day turnover threshold for all SKUs, with automatic discounting and removal from active stock for any item that exceeds the limit.
How to Build a Low-Risk High-Turnover SKU Combination for Your Line
A fixed 70% regular best-selling size + 20% trend customized size + 10% niche special size allocation consistently delivers 25% higher inventory turnover across all customer segments, from bulk distributors to online sellers. This structure balances stable core revenue with upside from fast-changing style trends.
A qualified Chinese alloy wheel manufacturer with multi-region supply experience, flexible low-MOQ terms and full system certification including ISO, VIA and TüV can drastically reduce delivery risk for your core best-selling SKUs. Jinan Yoker Auto Parts, a leading Chinese manufacturer with 10 million pieces annual production capacity covering 12-24 inch full size lines, offers 20-piece minimum orders for standard stock items and 100-piece minimums for custom designs to support flexible test and bulk order needs.